One of the common question that students internally debate is how many schools, college, or universities to apply to. Is five “good enough”? How about ten? Twenty? The same goes for prospective job-seekers. A common thought that runs through their heads is ‘How many jobs should I apply for?’
By taking a statistical approach to the situation, I hope to shed some insight into how many applications one should submit in order to give them a robust chance of getting at least one viable offer or letter of admission.
Like any statistical problem, there are variables and inputs involved. And some intrinsic level of uncertainty altogether.
We can use models and collect data to predict the future and produce close, but never perfect, estimations. The future is, of course, inherently unknowable.
Based on the matter in question, one’s chances largely depend on your odds of getting into a particular job or school. Ideally, you should choose from among a list of schools where your objective statistics – e.g., GPA, standardized test scores – are within the range of those they typically admit and enroll.
If your GPA and SAT scores are 3.4 and 1850, respectively, your odds at the top colleges in the country won’t be great unless you have some outstanding accomplishments or special form of social status that can’t be represented through academic work and standardized testing.
However, those GPA and SAT credentials would be very competitive among state schools and at mid-tier private colleges.
Your odds of receiving at least one admission from a given number schools applied to can be modeled by the following equation:
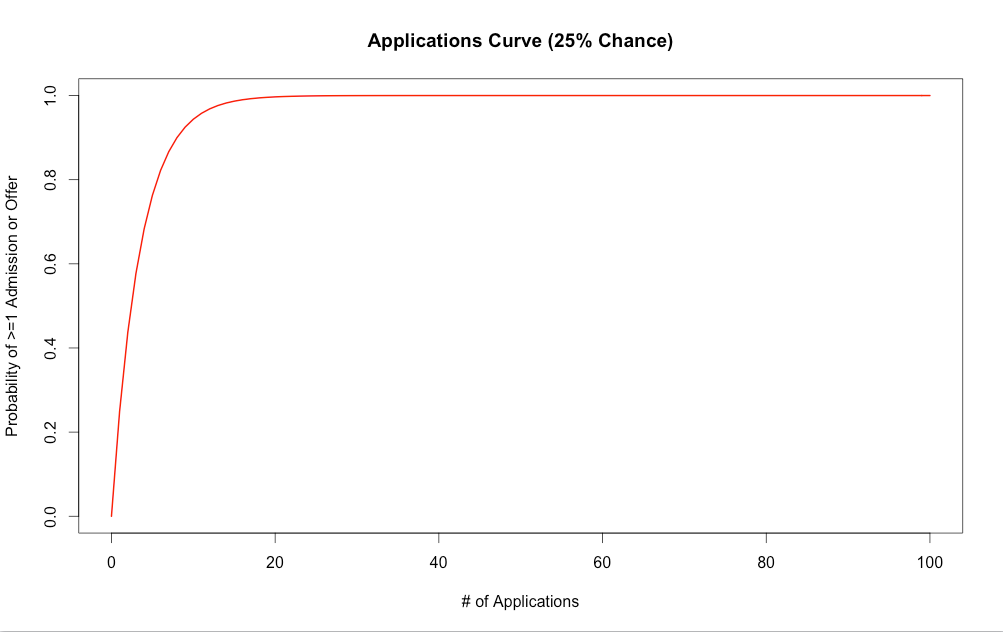
With even 1 out of 4 odds, the probability curve is still rather steep. If you applied to ten schools, you would have a 94.3% (1-.75^10) chance of getting at least one letter of admission. That’s pretty good as a whole.
If you wanted to base your decision-making off a confidence interval – or how confident you wanted to be in getting at least one offer, you could go by the following equation:
For those who enjoy geeking out with formulas and simulations in R, you could apply the following code to solve this problem:
#95% sure you want to have at least one offer

#25% change of acceptance/75% chance of rejection
foo <- function(x, y){y – 1 + (3/4)^x}; uniroot(foo, lower = -1000, upper = 1000, y = 0.95)
However, college admissions on the selectivity scale actually tend to not be that bad. Even colleges and universities that sport sub-10% acceptance rates won’t look all that intimidating when it comes to one’s chances at admission to various professional schools and employment opportunities.
Many medical and law schools have admission rates under 5%. And many jobs receive hundreds or even thousands of applicants when just one individual will be left with the job in the end.
In these cases, it’s important to seek out applying to opportunities where you are a match in terms of objective credentials and/or skill set.
If you’re applying to medical school, for example, it’s essential to have GPA and MCAT credentials that are at least a strong match relative to matriculants to that particular school.
On the same token, when applying for employment, your skill set should as best match that particular position as possible to maximize your chances of success.
Even then, receiving an offer can be difficult due to the competition involved.
If you apply to only opportunities for which you’re qualified, you should have little issue assuming you submit a sufficient volume of applications.
Nonetheless, in very competitive fields – such as applying to positions within academia – your chances will often be less than 3% for any given opportunity.
The obvious part of the strategy is to apply mainly to positions for which you’re qualified. It would also be a good idea to apply to some opportunities for which you are over-qualified to have more of a safety net. Just be sure that you’re willing to accept such an offer if luck goes against you otherwise.
Some “dream” opportunities should be considered, as well, if interested.
Even if you’re a law school applicant and your GPA and LSAT only fall into the 10th percentile of students attending, it might be worth a chance if you’ve always aspired to attend to that particular institution.
Having a mix of options is best – one where you might have a 30% chance, 5% chance, and 10% chance for any particular three prospective opportunities selected randomly from your overall application stream.
Added together, those three options represent a 15% average chance.
Now you might be thinking, how do I determine my average chances?
Well, without having access to actual data and average applicant qualifications relative to the opportunities desired, it wouldn’t be feasible to know exactly.
However, if you do have access and are generally familiar with the type of opportunities you’re going for, you might have some idea, but it’s difficult to know precisely.
With that part considered, I decided to go through the type of strategy one might typically employ if one’s averages chances of receiving an offer for any given opportunity are 10%, 5%, 2%, and 1%, respectively. I will go through each individually to provide a graphical look in addition to some sample statistics:
10% Average Chance of Receiving an Offer
At 10%, your chances of receiving at least one offer would follow a curve as such:
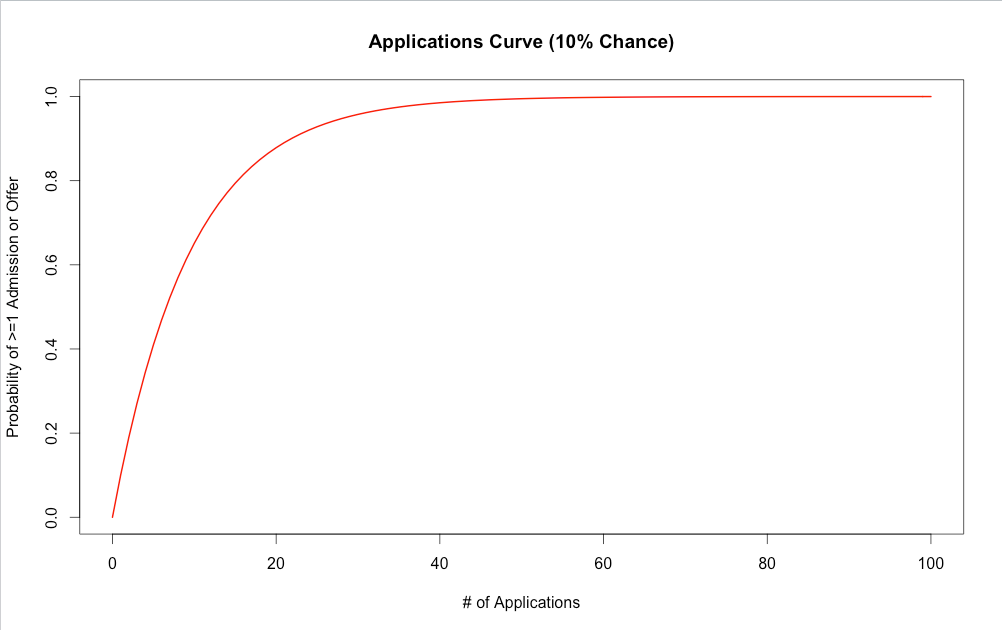
As you can see, it’s definitely not quite as steep as the 25% probability curve, it’s still relatively vertical. If you submitted 20 applications, your odds of receiving at least one offer would be 87.8% (1-0.90^20).
If you wanted to be 95% sure you would have at least one offer, you would submit 29. That means if you simulated the process 20 times, 19 of those times you would have at least one offer assuming you submitted 29 applications at 10% acceptance odds.
For a 99% confidence interval, you would need to submit 44 applications.
5%
Once we double the selectivity, we can see the curve begin to flatten. Our scale runs from 0-100 on the “# of Applications” axis.
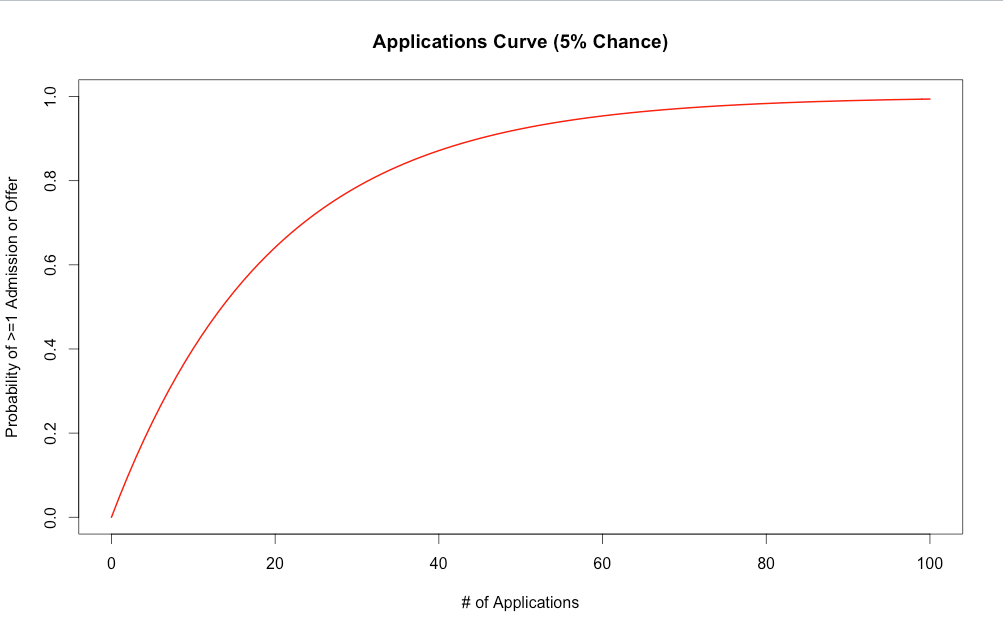
In this case, we aren’t surpassing the 0.90 or 90% probability threshold until 45 applications have been submitted. We don’t surpass 95% confidence until we’ve sent 59. To get all the way up to 99% confidence, we would have to submit 90.
If you genuinely had 5% odds and only submitted 15 applications – which is technically a lot in itself – your odds of obtaining at least one offer of admission would be just 53.7%.
When this is your future at stake, and something that could dictate how the rest of your life might play out, you don’t want to gamble with such relatively low odds.
2%
Getting down to 2% selectivity is reserved for things like positions within academia, particularly if one is seeking out his or her first professorship after completing a Ph.D.
Once we get down to 2% we really begin to see the curve beginning to markedly flatten. It looks starkly different from even the 10% curve. As one gets closer to 0% the curve begins to smooth out in exponential fashion.
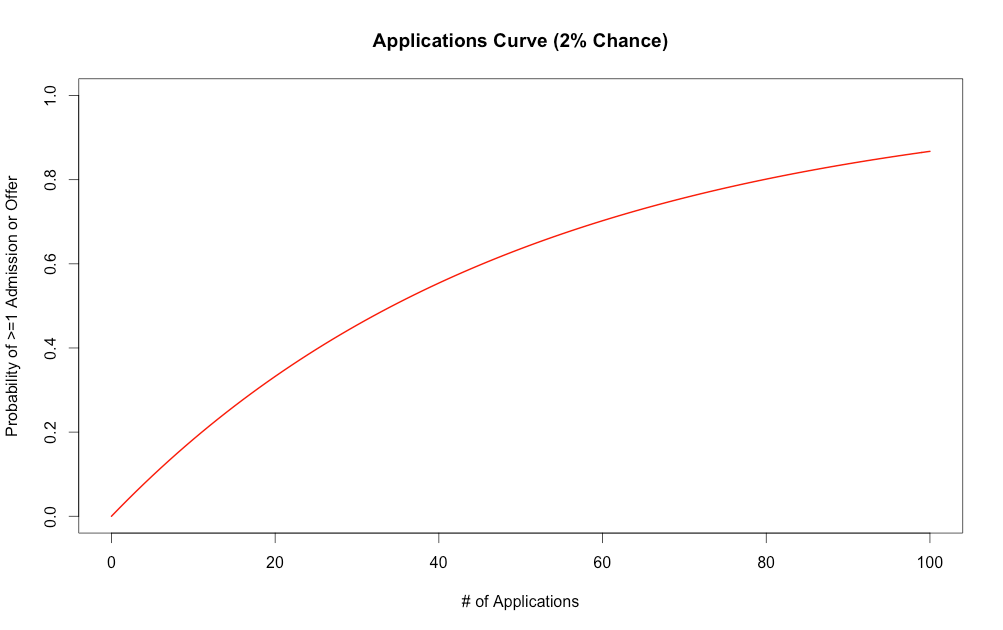
If you applied to 25 different opportunities with 2% average odds, your chances of success would sit at just 40% of obtaining one offer. You would need to apply to at least 35 to have 50-50 odds or better. To have 90% confidence that you would have at least one offer, you would need to submit 114 applications.
1%
At 1% average odds, the volume of applications you would have to submit to be fairly confident of an offer would be enormous.
Here the graph is flat to the point where is barely surpasses 60% odds of at least one offer by the end of the scale (100 applications).
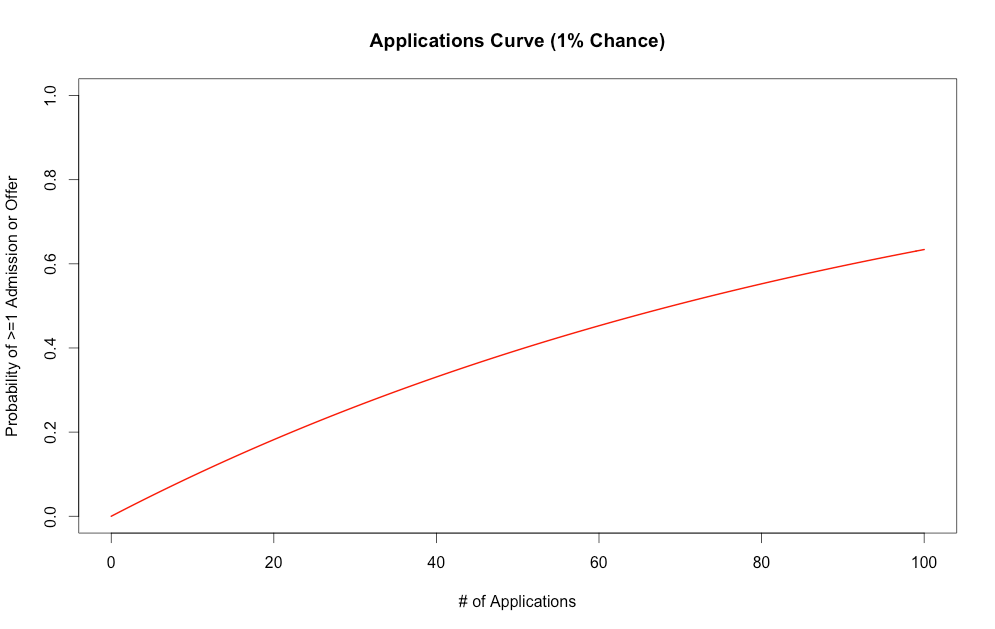
To have just 75% confidence that you would have at least one offer, you would need to submit 138 applications. If you wanted 90% confidence, you would need 229. For 95% and 99% confidence, you would need a whopping 299 and 459, respectively.
Suffice to say, once you get down to 1% odds, you chances are so low that many of the offers you’re applying to you’ll effectively have odds of exactly zero.
This is precisely why applying to matches in terms of credentials and/or skills is important. Then your chances will only be this low (or worse) if each slot available has an application stream of at least 99 other applicants who also meet every stipulated qualification.
Conclusion
If you plan your job search correctly or college search or any type of opportunity where there is some inherent level of competition and selectivity involved, you shouldn’t be facing 1% average odds.
It does certainly depend on the type of career. But ideally, you’ll be facing 5% odds or better on average.
Then if you apply broadly enough, the odds will be in your favor of landing at least one offer.


