Professionals in the financial industry use R to perform statistical analyses regarding a variety of financial data. The common question many have is how to upload data sourced from online resources into R in the fastest and most efficient way possible.
There are a variety of paid services that offer financial data, including Bloomberg and Morningstar, but Yahoo Finance provides a means to access much of the same data for free. It may lack some of the analytical tools that come with a popular paid service, but that might be precisely why you’ve decided to run your own analysis in R to begin with.
For many types of financial modeling tasks, real data input will be required.
For a stock, you can access day-by-day data such as open, high, low, close, volume of shares traded, and adjusted close.
This simple way of downloading financial data from Yahoo Finance and uploading in R should take no more than a couple minutes and is very straightforward.
The Steps
1. Go to finance.yahoo.com
2. Type in the stock or financial asset of interest (I did Facebook (FB) in this case)

3. Click on “Historical Prices” in the left menu bar (fourth item down)
4. Go all the way to the bottom of the page where it says “Download to Spreadsheet”
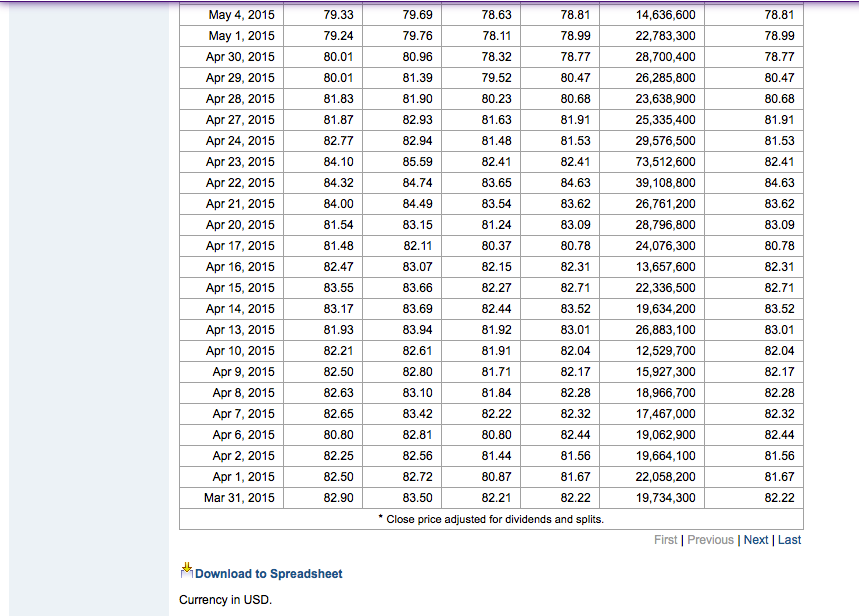
5. “Select all” the values in the new tab (CTRL + A for Windows, Command + A for Mac)

6. Paste to a Text File (with an application such as Text Edit)
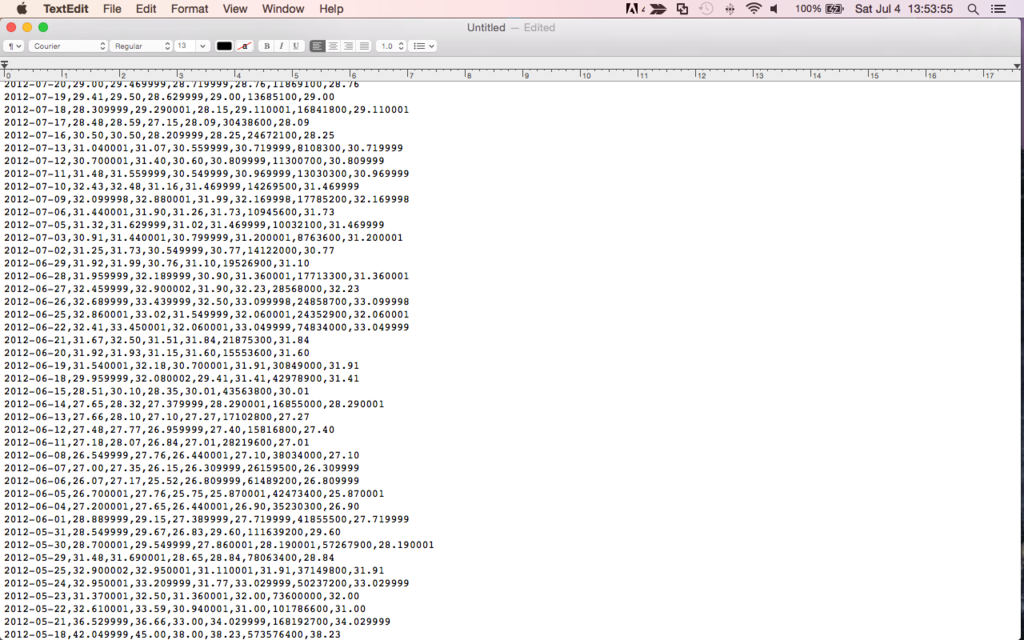
7. Save as (choose relevant name).csv (comma separated value format)

8. Open up Excel
9. Go to the File menu, down to Open and select the file name you just created and you will have your data set

10. Open R Studio
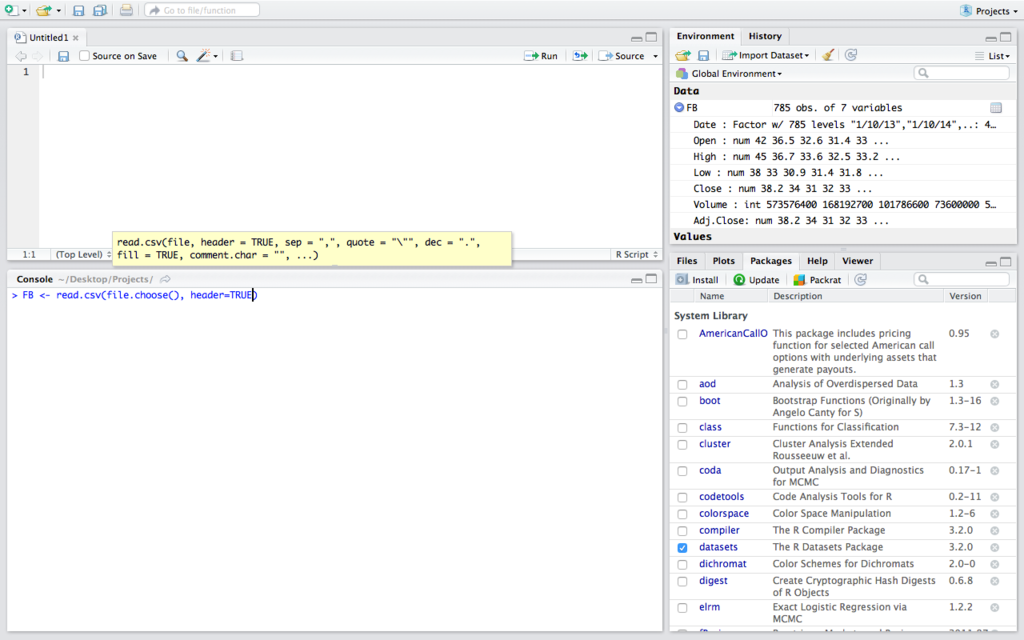
11. Use the read.csv(file.choose(), header=TRUE) line to upload your data in R
12. Name it as an object for easy reference, like (Insert Ticker Symbol) <- read.csv(file.choose(), header=TRUE)
There are of course many ways in which you can analyze stock data in R.
If you came for purposes of learning how to upload financial data into R, then you probably have a good idea of what kind of analysis you’re looking to perform in the first place.
One of my favorite basic things to do with this data is form a density plot to determine how profitable this stock has been within the given data set chosen.
It’s just a general means to determine its recent performance beyond what can be determined by looking at a basic line chart.
A simple way to do this is in terms of daily returns as a decimal, equal to (Closing price – opening price)/Closing price.
The code for this is as follows:
returns <- (Close-Open)/Close
d <- density(returns)
plot(d, main=”FB Return Density Curve”)
abline(v=0)
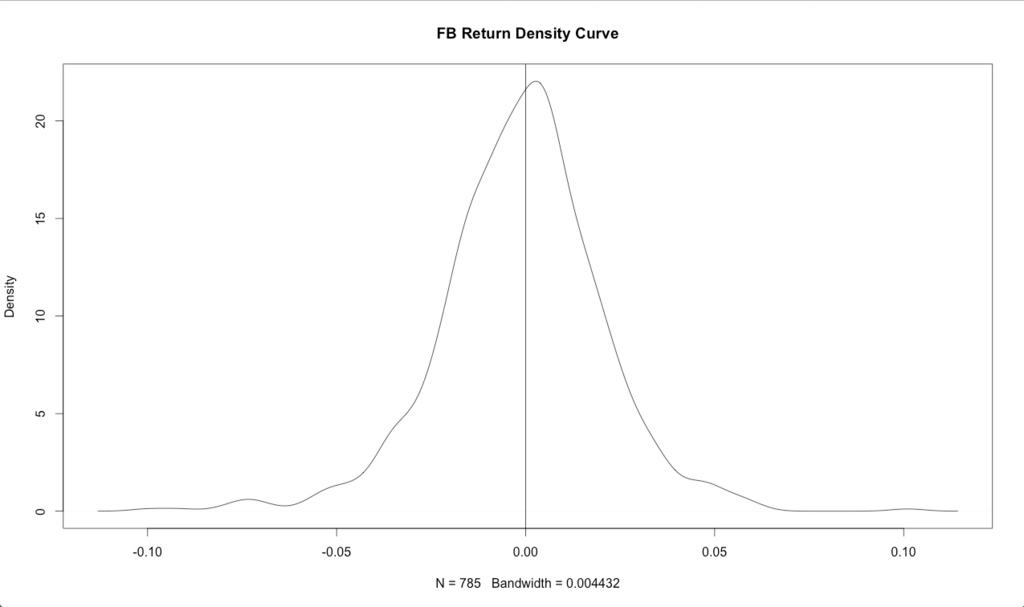
To find the relative proportion of the days that this stock was profitable, the pnorm() command can be used.
For average returns, or the dispersion in the data, the mean and standard deviations can also be ascertained by running each line individually:
mean(returns)
sd(returns)
1-pnorm(0,mean(returns),sd(returns))
The pnorm() command states the probability that any given data point will be below a certain threshold given mean and standard deviation inputs about the data assuming it follows a normal distribution.
We can subtract this from one to determine the proportion of days that we are above zero instead of below.
In future articles, we will look at more advanced ways of looking at financial data in R, and doing some actual financial modeling to predict its future performance.


